
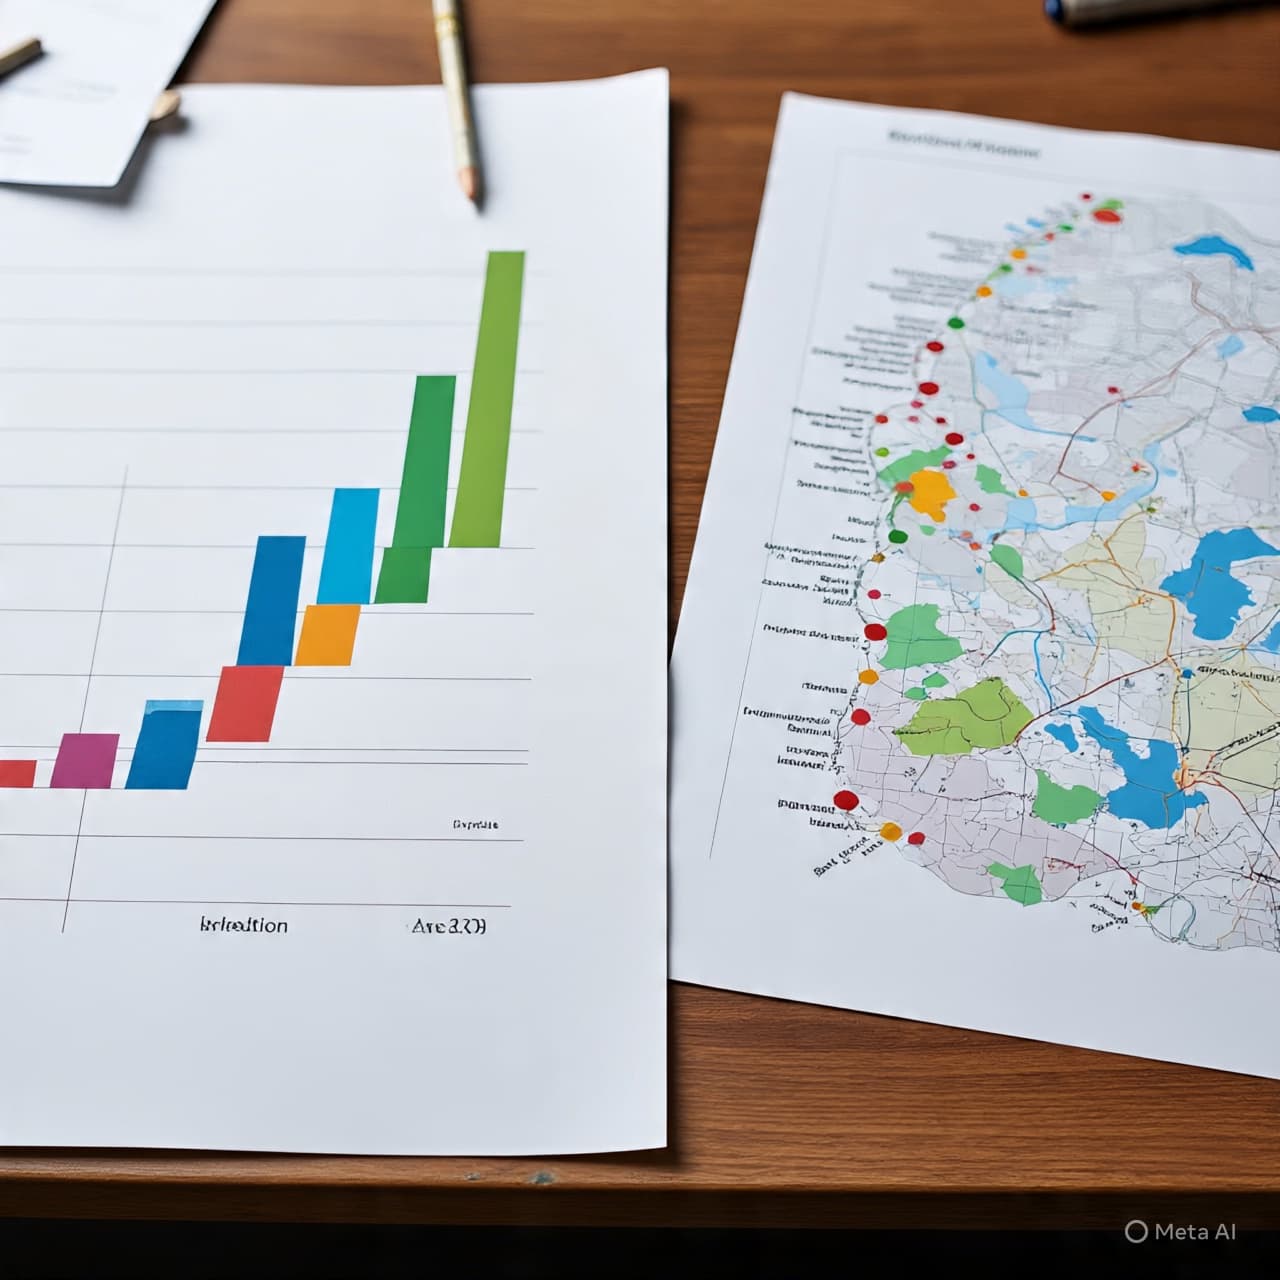
In the old days, the sources of smoke and soot were easy to see — the towering stacks of coal plants, the refineries’ dark plumes against an evening sky. But in an era defined by digital precision and climate urgency, those vague impressions have given way to something far more detailed: a map that shows exactly where carbon dioxide emissions are coming from in the United States, down to the scale of city blocks, individual highways, and even single industrial facilities. That effort, published this week as part of ongoing scientific research, reveals both familiar and surprising patterns in where America’s dirtiest carbon polluters are located and how their emissions shape the landscape of climate risk.
The map comes from the Vulcan project, an extensive scientific dataset developed over decades to quantify fossil fuel CO₂ emissions across the U.S. at remarkably fine resolution — a resource researchers describe as vital for understanding the true contours of climate change. Rather than relying solely on broad estimates, the visualizations tie emissions to specific sources: power plants, factories, busy roadways, and dense urban areas, revealing hotspots where carbon concentrations are highest.
Unsurprisingly, the eastern half of the country — home to large populations, industrial centers, and heavy manufacturing — shows the most intense emissions, with bright red zones concentrated around cities and transportation corridors. Major metropolitan areas and adjacent power plants stand out clearly, underscoring how energy use and urban activity intertwine with climate impact.
Those patterns echo what broader greenhouse‑gas reporting data from the U.S. Environmental Protection Agency’s Greenhouse Gas Reporting Program (GHGRP) shows at a national level: thousands of large facilities — including power plants, refineries, and heavy industrial sites — together report billions of metric tons of carbon dioxide equivalent emissions annually. While federal reporting provides totals for major emitters, the Vulcan map adds geographic granularity, placing those emissions in a vivid spatial context that helps scientists, policymakers, and the public pinpoint where the biggest concentrations occur.
Other data sources likewise show that the largest stationary emitters in the U.S. remain fossil‑fuel power plants and related industrial facilities. Independent compilations of emissions data identify individual power stations and plants — such as Alabama Power’s James H. Miller Jr. coal plant and large natural‑gas facilities in the Midwest and Texas — among the top sources of CO₂ in recent years.
Understanding where carbon pollution originates is not merely academic. It shapes climate mitigation strategies, informs air quality planning, and underpins accountability for reducing atmospheric greenhouse gas concentrations. As policymakers and communities debate how to tackle climate change, *the granular picture now emerging — showing not just quantities but locations of emissions — offers a new lens through which to assess progress and prioritize action.
In an age where carbon is both invisible and omnipresent, the ability to map it so precisely is a reminder: the challenge of climate change is deeply rooted in everyday places and patterns, from highways humming with traffic to towering stacks at industrial hubs. Bringing those sources into view is one step toward shaping solutions that are as detailed and grounded as the problems they seek to address.
AI Image Disclaimer Illustrations were produced with AI and serve as conceptual depictions.
Sources
• “America’s Dirtiest Carbon Polluters, Mapped to Ridiculous Precision,” reporting on the Vulcan emissions map and its scientific context.
• EPA GREENHOUSE GAS REPORTING PROGRAM interactive location data and facility emissions totals.
• Independent compilations listing the largest greenhouse gas emitting facilities in the U.S. by sector.
Published by Banx Network. This article is part of the Banx decentralized media programme, powered by the BXE token on the XRP Ledger.