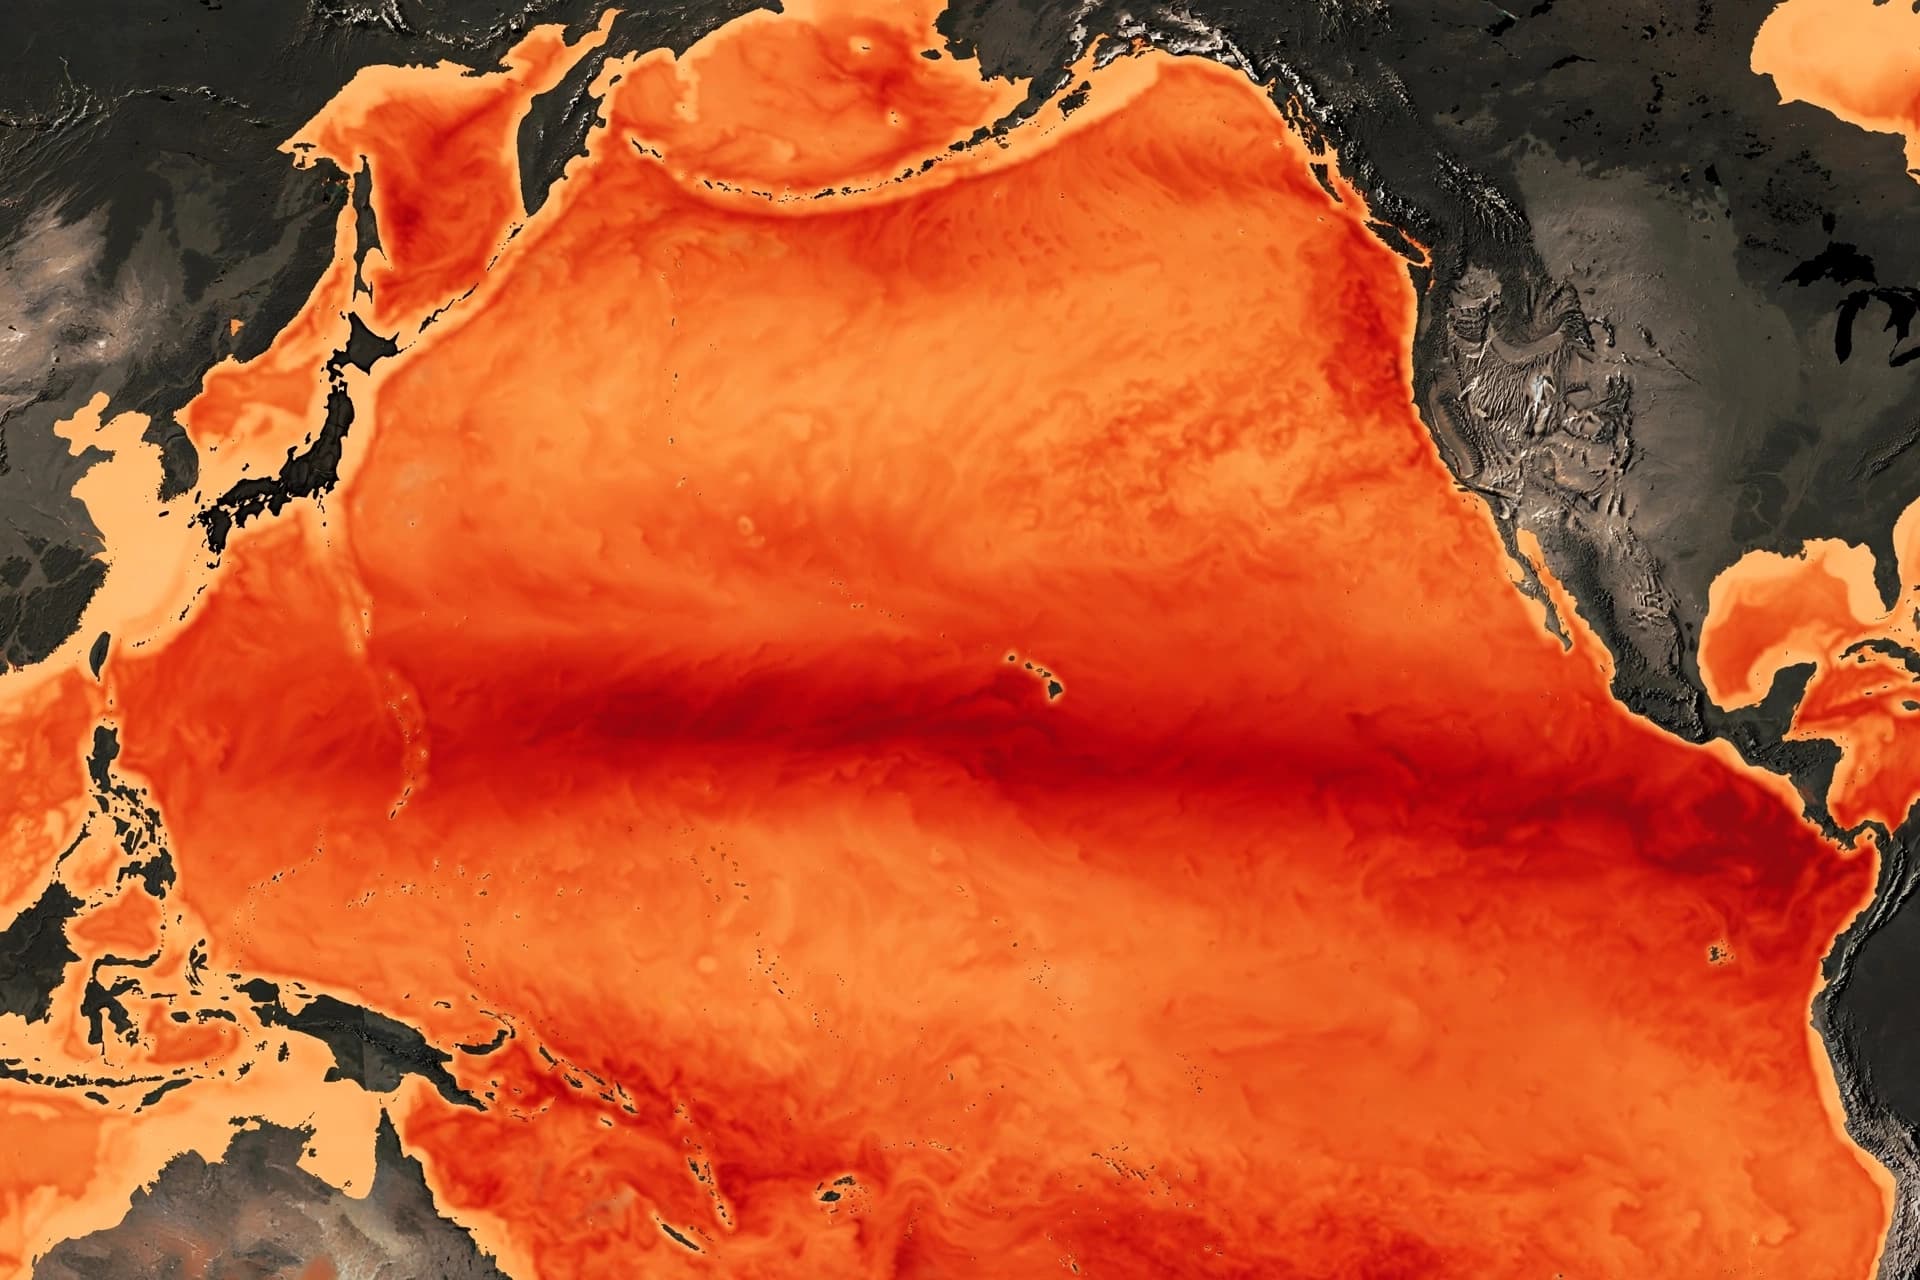
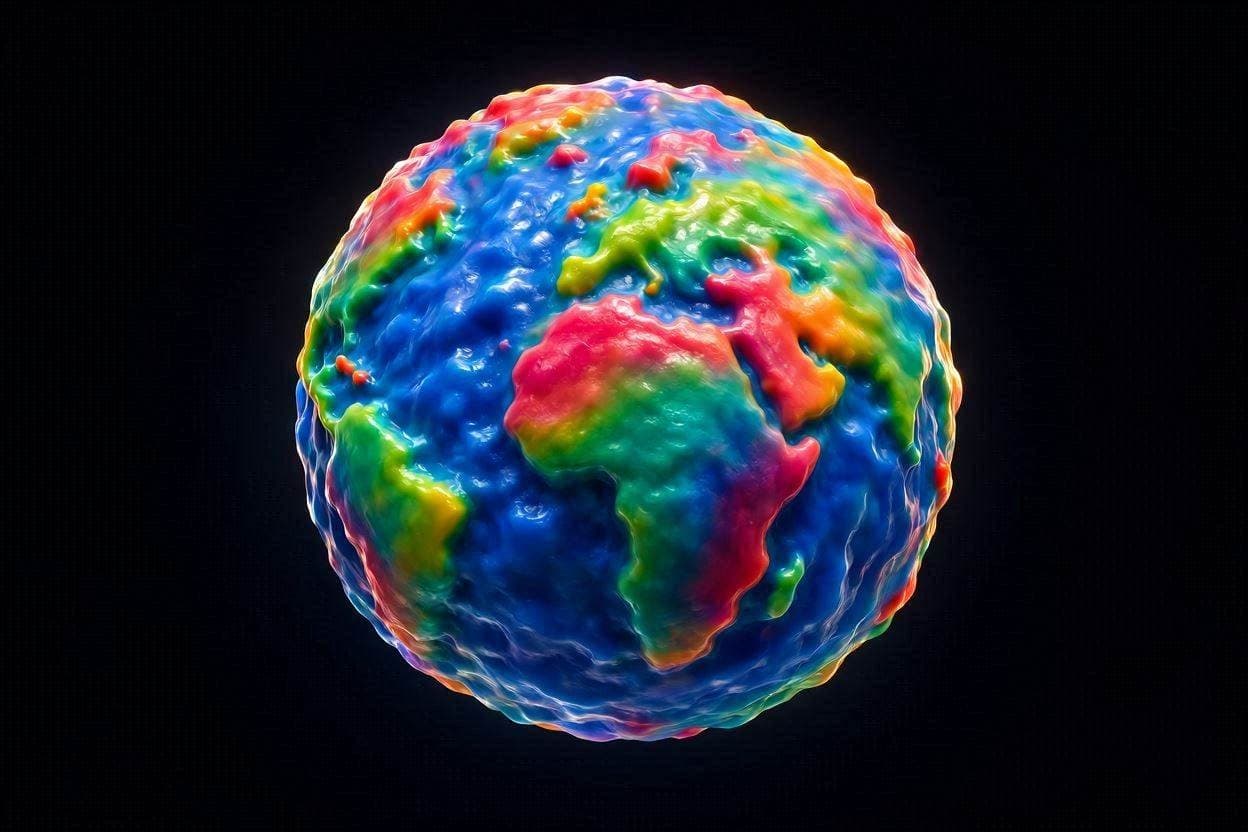
From the vantage point of space, Earth appears as a serene blue marble, perfectly round and tranquil. Yet, beneath this visual simplicity lies a complex reality shaped by gravity and mass distribution. NASA’s latest gravity-based models reveal that our planet is not a perfect sphere, nor even a simple ellipsoid, but a lumpy, irregular form known as the geoid. This "potato-shaped" representation reflects variations in Earth’s gravitational field, offering a more accurate picture of our home. It is a reminder that truth often resides in the details, inviting us to look beyond appearances to understand the forces that define our world.
The geoid model serves as a crucial tool for scientists studying sea level rise, ocean currents, and climate change. It highlights the dynamic nature of our planet and the precision required to measure it.
Body: The geoid is defined as the shape that the ocean surface would take under the influence of Earth’s gravity and rotation alone, ignoring other factors like winds and tides. Because Earth’s mass is not evenly distributed—due to mountains, ocean trenches, and density variations in the mantle—gravity varies across the globe. These variations cause the geoid to deviate from a smooth ellipsoid, creating highs and lows that can span over 100 meters.
NASA’s Gravity Recovery and Climate Experiment (GRACE) and its successor, GRACE-FO, have provided unprecedented data on these gravitational anomalies. By measuring the distance between two satellites as they orbit Earth, scientists can map the planet’s gravity field with high precision. This data allows for the creation of detailed geoid models that are essential for accurate height measurements.
For oceanographers, the geoid is the reference surface for measuring sea level. Without it, determining whether sea levels are rising due to climate change or simply reflecting local gravitational quirks would be impossible. The model helps distinguish between actual water volume changes and shifts in the Earth’s crust or gravity field.
The visual representation of the geoid, often color-coded to show gravitational highs and lows, looks nothing like the smooth globes we see in classrooms. It is a vibrant, textured map of invisible forces. This visualization helps communicate complex scientific concepts to the public, fostering a deeper appreciation for Earth’s complexity.
Geodesists use the geoid to improve GPS accuracy and surveying. By understanding the local vertical direction defined by gravity, engineers can build infrastructure that accounts for subtle variations in elevation. This precision is vital for large-scale projects like bridges, tunnels, and flood barriers.
The ongoing refinement of geoid models also aids in monitoring ice sheet loss in Greenland and Antarctica. Changes in mass affect the local gravity field, which can be detected by satellites. This information is critical for predicting future sea level rise and planning mitigation strategies.
As technology advances, our understanding of the geoid will become even more precise. Future missions may carry instruments with higher sensitivity, revealing smaller-scale features and temporal changes. This continuous improvement supports a wide range of scientific and practical applications.
The geoid reminds us that Earth is a dynamic, living system. Its shape is not static but evolves with the movement of mass within and on its surface. Studying it helps us understand the planet’s past, present, and future.
Closing: NASA’s gravity-based geoid model reveals the true, irregular shape of Earth, providing essential data for climate science and geodesy. It invites a deeper appreciation for the complex forces shaping our planet.
AI Image Disclaimer: Images used in this report are AI-generated depictions intended to illustrate the themes of geodesy and planetary science.
Sources: NASA National Oceanic and Atmospheric Administration (NOAA) Scientific American Earth Observatory
Published by Banx Network. This article is part of the Banx decentralized media programme, powered by the BXE token on the XRP Ledger.