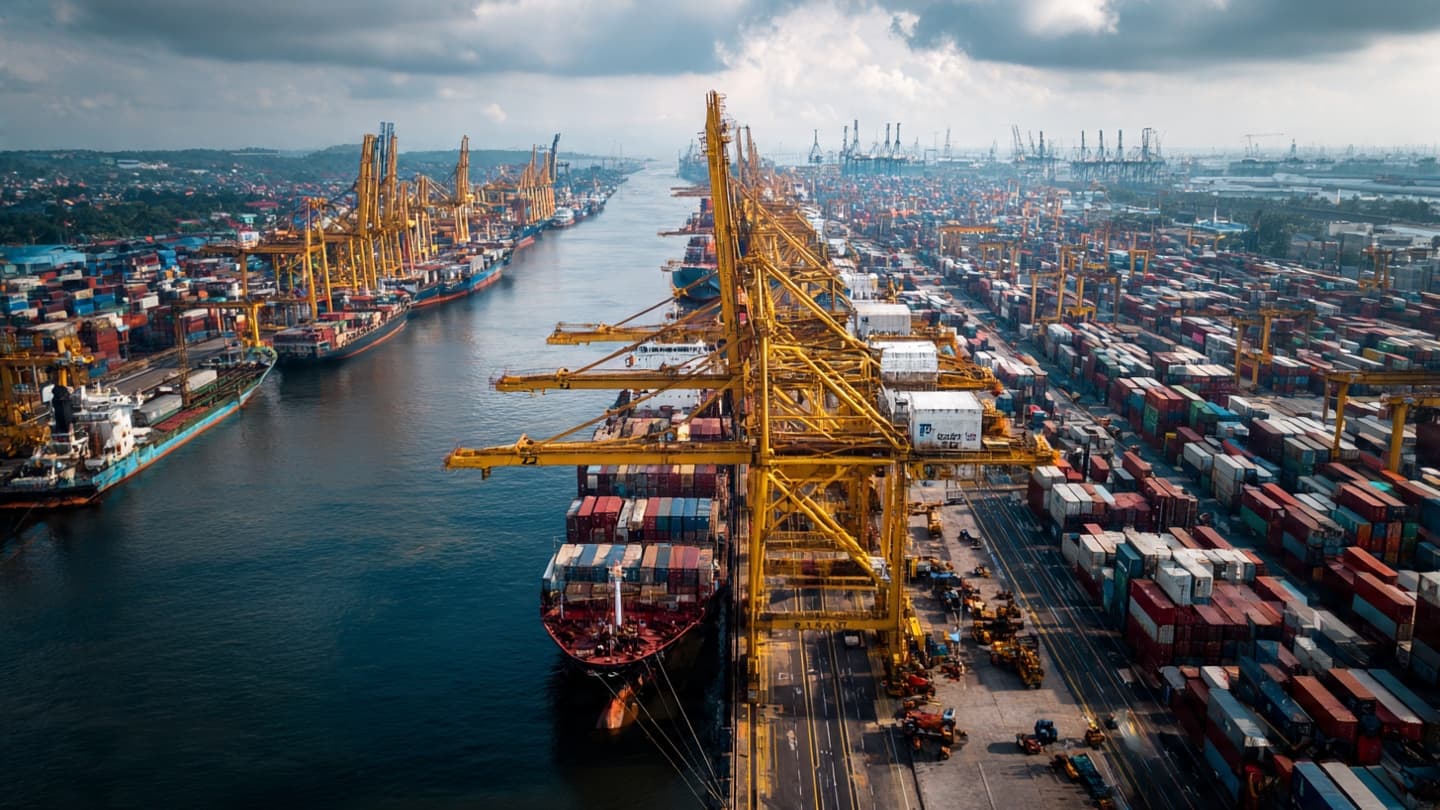
Along Indonesia's ports, the movement of containers rarely pauses. Ships arrive with raw materials and machinery, while other vessels carry products made across the country's factories toward markets abroad. Behind that physical movement is another current, measured each month through the trade balance.
Indonesia recorded a goods trade surplus of $3.70 billion for the January-July 2026 period, according to Statistics Indonesia, or BPS. Cumulative exports reached $167.03 billion, increasing 4.43% from the same period a year earlier.
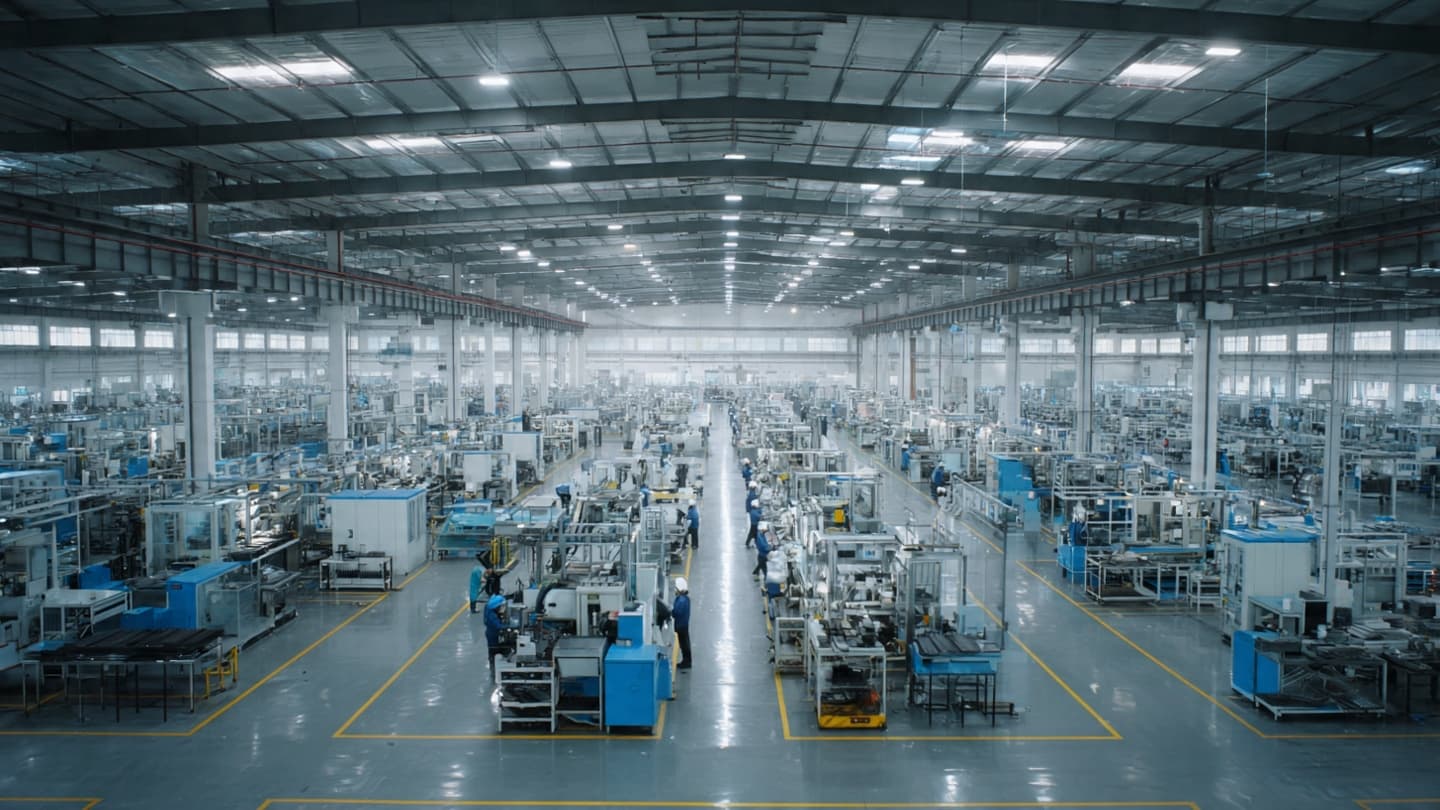
Manufacturing remained the largest contributor to cumulative exports. The sector accounted for $137.26 billion during the first seven months of the year, followed by mining and other sectors at $19.60 billion, while agriculture, forestry, and fisheries contributed $3.15 billion.
The figures show the continued importance of processed and manufactured goods in Indonesia's export structure. Factories connected to domestic and international supply chains remain central to the country's ability to generate foreign-exchange earnings through exports.
Imports, meanwhile, reached $163.33 billion during January-July, an increase of 19.94% compared with the same period last year. Most imports consisted of raw and supporting materials, valued at $116.70 billion, followed by capital goods at $32.46 billion and consumer goods at $14.16 billion.
The composition of imports offers another view of economic activity. Raw materials and supporting goods make up the largest portion, suggesting that a substantial part of imported products is connected to production and industrial activity rather than direct household consumption.
The monthly picture for July was considerably narrower. Indonesia recorded a trade surplus of just $120 million that month, with exports at $26.22 billion and imports at $26.09 billion. Exports grew 6.05% year over year, while imports increased 27.02%.
The faster growth of imports in July means that the overall seven-month surplus is being maintained alongside a much stronger flow of goods entering the country. That movement can reflect demand from manufacturers and businesses requiring materials and equipment for production.
Within July's non-oil and gas exports, manufacturing contributed $21.76 billion, mining contributed $3.10 billion, and agriculture, forestry, and fisheries contributed $570 million. These figures underline the continued role of manufacturing in Indonesia's trade performance.
As the year moves toward its final months, Indonesia's trade figures will continue to be shaped by export demand, commodity prices, industrial production, and domestic requirements for imported materials and capital equipment. The January-July balance remains positive, while the July numbers show how closely exports and imports are now moving alongside one another.
AI IMAGE DISCLAIMER
The accompanying visuals were created with AI as conceptual representations of Indonesia’s international trade and are not real photographs.
SOURCES
ANTARA News
Published by Banx Network. This article is part of the Banx decentralized media programme, powered by the BXE token on the XRP Ledger.