
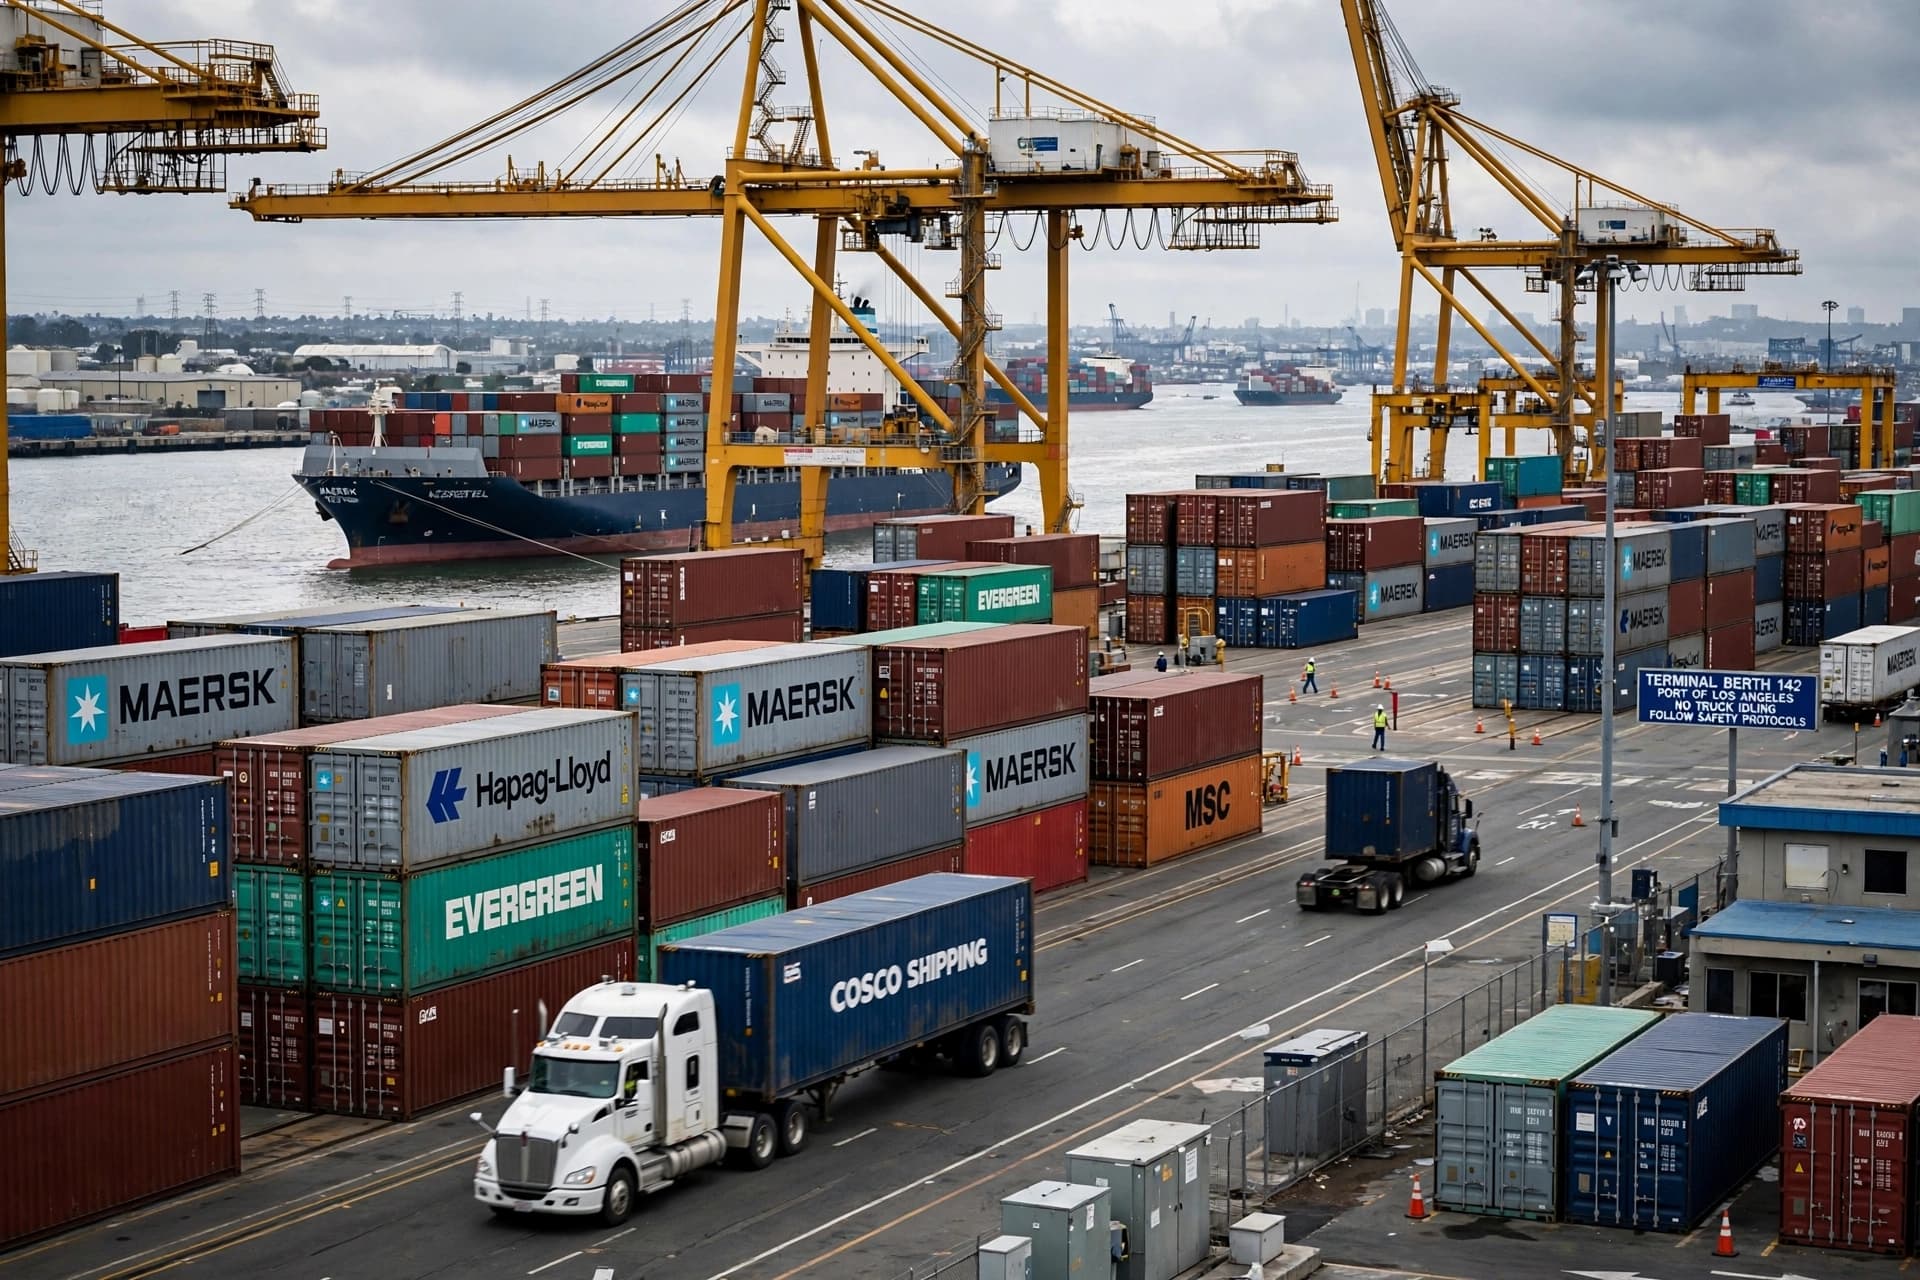
There are moments when the movement of goods across borders tells a story more quietly than the headlines do. Ships arrive, containers are unloaded, orders are recorded, and the enormous machinery of international commerce continues almost without pause. Yet beneath those ordinary movements, the balance between what a country buys from the world and what it sells can begin to reveal another rhythm.
For the United States, that rhythm became more pronounced during the second quarter of 2026. The current-account deficit widened by $33.4 billion, or 15.7%, to $246 billion, according to the Commerce Department’s Bureau of Economic Analysis. The deficit represented 3% of gross domestic product, up from 2.7% in the first quarter.
Much of the movement came from goods entering the country. Imports of goods increased by $67.4 billion to $931.6 billion, while exports increased by $27.1 billion to $640.3 billion. The difference pushed the goods trade deficit $40.4 billion higher, to $291.3 billion.
The current account, however, extends beyond the familiar trade balance. It also records international flows involving services and income. During the second quarter, the primary income balance narrowed to $11.4 billion from $15.8 billion in the first quarter, as both income receipts and payments increased.
For companies, these figures represent decisions that are often made far from economic statistics. A manufacturer chooses where to source components. A retailer decides how much merchandise to bring into the country. A technology company expands an international supply chain. Each individual decision becomes part of a much larger movement when viewed through national economic data.
The rise in imports also illustrates the scale of America’s connection to the global economy. Goods cross oceans and borders every day, linking American consumers and businesses with producers, manufacturers and suppliers around the world. The current-account figures provide one way of observing that enormous network from a distance.
Trade also subtracted 1.14 percentage points from U.S. gross domestic product in the second quarter. Reuters reported that trade had been a drag on economic growth for three consecutive quarters, adding another dimension to the latest international-trade figures.
Meanwhile, the country’s net international investment position deteriorated further. The deficit reached $22.42 trillion at the end of the second quarter, compared with $21.27 trillion in the first quarter. U.S. residents held $46.97 trillion in foreign assets, while liabilities stood at $69.39 trillion.
The numbers do not describe a single story about the American economy. They are pieces of a much wider picture involving consumption, production, investment, international finance and the movement of goods. Behind every quarterly figure are ships at ports, factories producing components, businesses placing orders and consumers purchasing products. The latest data simply offer another view of how deeply the United States remains connected to the wider world.
IMAGE DISCLAIMER
These visuals are AI-generated conceptual illustrations and are not photographs of the actual economic activity.
SOURCES
Reuters U.S. Bureau of Economic Analysis
Published by Banx Network. This article is part of the Banx decentralized media programme, powered by the BXE token on the XRP Ledger.