
We talk about the Internet as if it is a solid object. But the Internet is not a building — it is a weather system. Packets shift, servers fail, content routes around catastrophe, and latency floats like heat shimmer off desert asphalt. Measuring such a thing is like trying to pin a centimeter ruler onto a moving cloud. Numbers appear concrete, but the landscape is liquid.
Researchers warn us about this subtle trap: every metric we use to define the Internet is biased by the vantage point doing the measuring. A telco sees one shape of reality, a content delivery network sees another. A regulator sees lagging indicators, while a hyperscale cloud operator sees microsecond traces at continental edge nodes. We call these all “the Internet,” but they are slices, not the whole.
The public imagines that when we quote “average speeds” or “global traffic share,” these are universal truths. In reality, these metrics are stitched from partial mirrors. A speed test in Jakarta at 7 p.m. tells one truth. The same test at 2 a.m. in Frankfurt tells another. Stack enough partial truths, polish them with language, and the world begins to mistake the collage as a map.
The industry still struggles with a philosophical core: do we measure infrastructure, or do we measure experience? One number tells us the physics of backbone fiber. Another number tells us how a teenager in Nairobi feels inside a video stream that buffers twice before frame two. Both are real. But they are not the same.
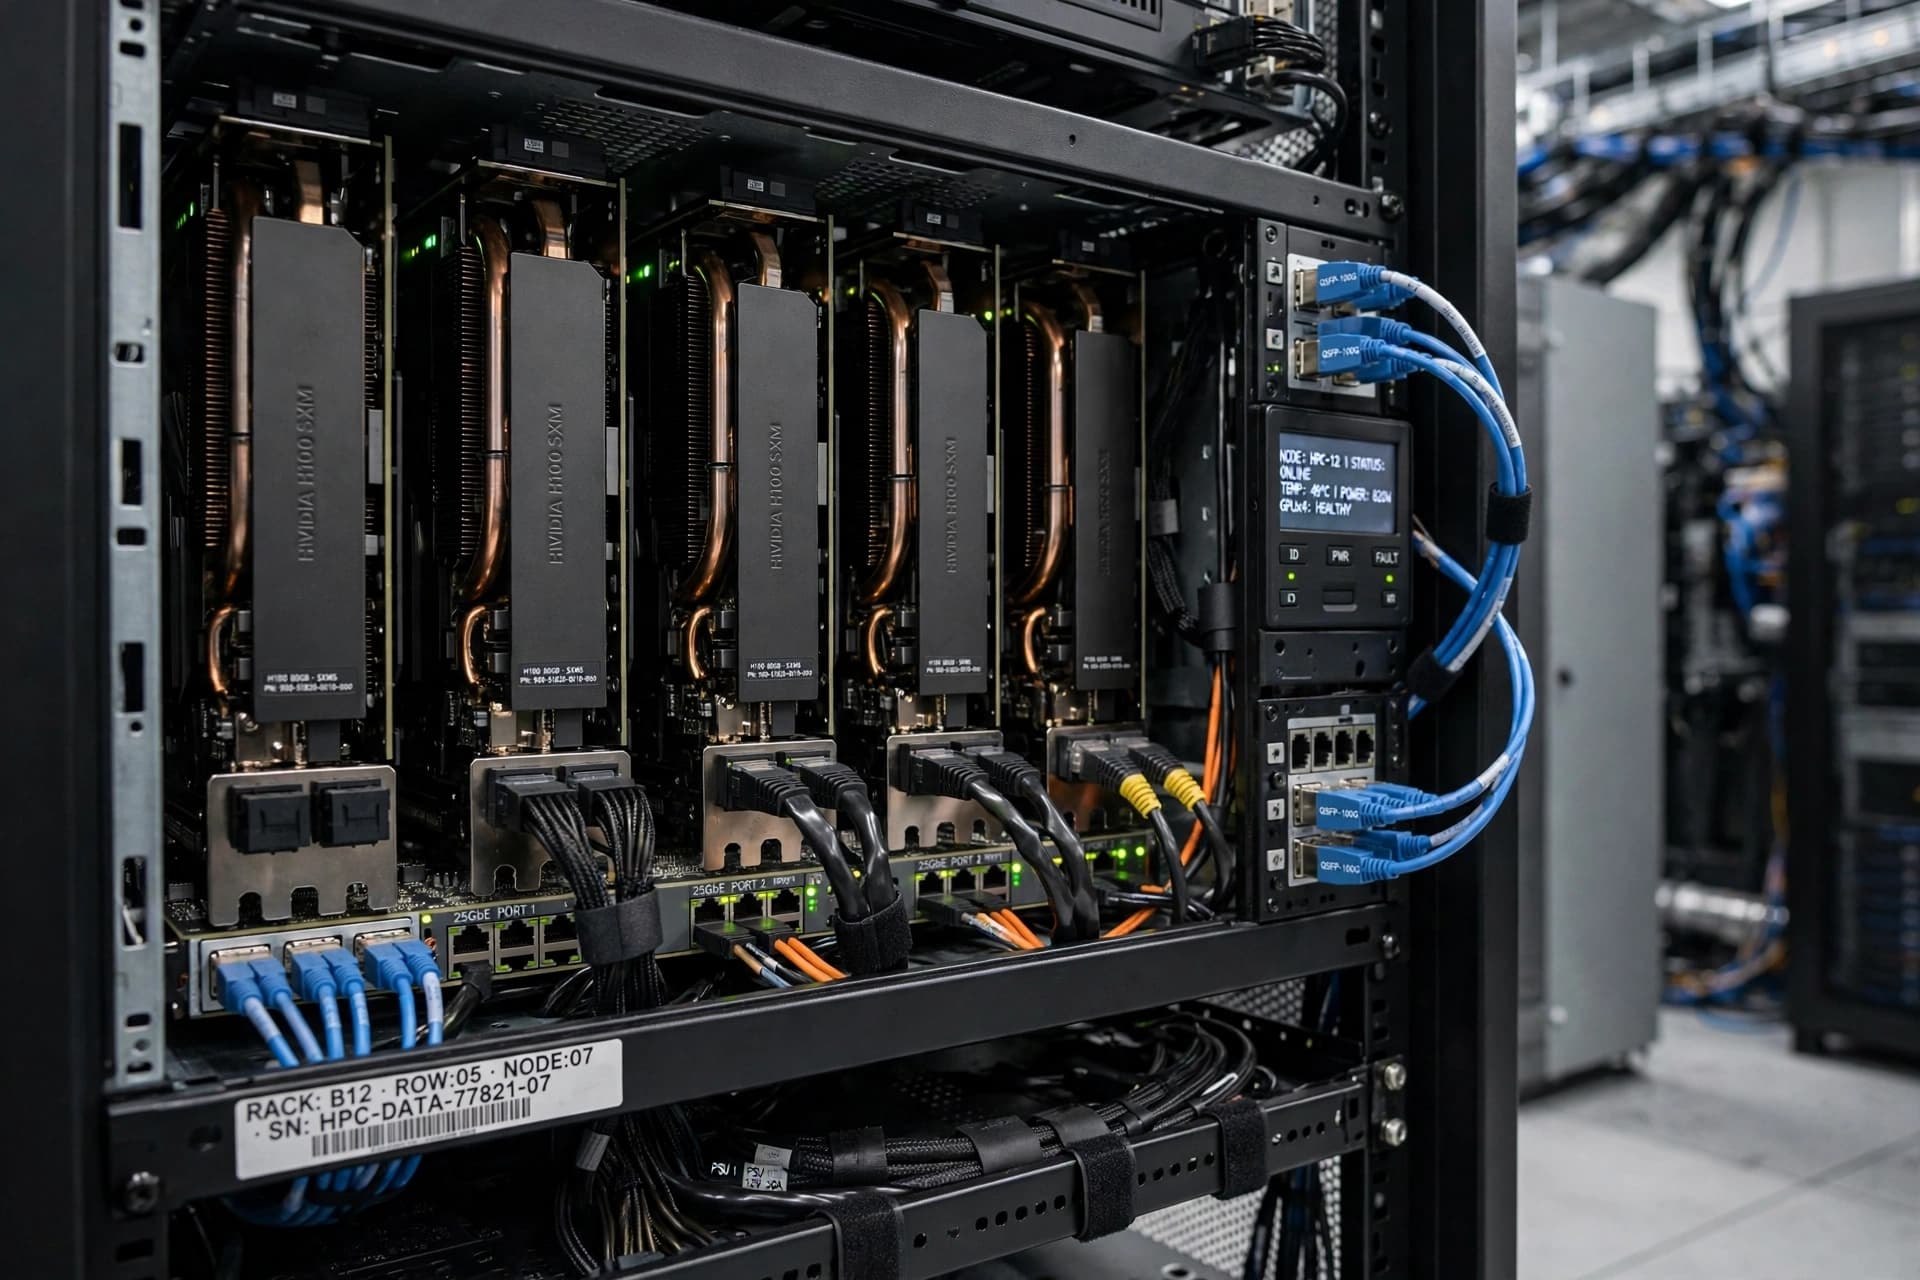
AI Image Disclaimer (rotated wording) Visuals are created with AI tools and are not real photographs.
Sources MIT Technology Review Wired
Published by Banx Network. This article is part of the Banx decentralized media programme, powered by the BXE token on the XRP Ledger.